In today's LLM world, the question remains: where does tabular data fit in? In this detailed analysis, we expand upon the TabLLM paper to better understand when and why you should use LLMs for tabular data tasks.
Tabular data remains a mainstay across industries, ranging from healthcare and climate, to finance. Businesses meticulously organize data like customer information, sales transactions, operations logs, and financial records into tables and spreadsheets.
While deep learning models like TabNet and TabTransformer have been developed for tabular data, they do not consistently stand above GBMs in cost or quality. Large Language Models (LLMs), meanwhile, are proving increasingly capable at tackling complex generative natural language tasks without having been explicitly trained to solve them. Their success on various tasks suggests the possibility that the inherent knowledge in an LLM could be useful also for understanding tabular data, if formatted adequately
"TabLLM: Few-shot Classification of Tabular Data with Large Language Models" (Hegselmann et al., 2023) attempted to evaluate this possibility by testing the application of LLMs across multiple tabular datasets. The paper established a method for zero-shot and few-shot tabular classification by serializing the data into text, combining each sample with a prompting question, and feeding the result into an LLM. While LLMs provide many advantages for tabular data, especially in low-data scenarios, they come with challenges as well.
In this post, we will demystify key concepts from the paper, provide a step-by-step guide to reproducing the study's results using Predibase, and give our insights on the practicality and suitability of LLMs for tabular data tasks.
Why would LLMs do well on Tabular Data at all?
As a thought exercise, and to form some intuition for why an LLM should be able to make predictions on tabular data, let’s take a look at an example from the original TabLLM paper on predicting the income of an individual from their age, education and gain:

Example from the TabLLM paper on predicting the income of an individual using tabular data.
If someone gave you this data and asked you to "predict if the person described by the last row makes more or less than 50K?" How would you answer this question? How confident are you in your answer? What evidence led you to that decision?
As English-reading humans, we likely read this information from left to right and pay attention to information like the column headings and the relationships between categorical variables, and we can provide the information to a LLM in a similar way.
The person is 42 years old. She has a Master. The gain is 594 dollars.
The semantics of both the column names and values play an important role in the ability of answering questions about the data. For instance, knowing that 12th grade is a lower education level than holding a college degree and that 29 is a young age for a worker makes answering the question easier. Moreover, cross-referencing values to some of the other examples provided helps us in our decision to answer either yes or no. That information can be provided in the prompt to the LLM too.
Given such context, answering a question such as, “does this person make more than $50K a year,” feels rather intuitive and a language model with the same context could be able to answer a similar question.
Formatting Tabular Data for LLMs: String Serialization
In order to provide tabular information to a LLM trained on text we need to serialize it in the form of a string. As early as the 3rd workshop on Neural Generation and Translation (EMNLP 2019), researchers were already experimenting with serializing tabular data into a text prompt to feed intro a pre-trained LLM. In 2020, T5 (Roberts, et al.) comprehensively reframed many NLP tasks (including data-to-text) into a unified text-to-text task where the inputs and outputs are always text strings.

From the TabLLM paper – different ways of converting tabular data into a text string.
Experimental Setup
To determine whether LLMs can compete with models like GBTs, widely considered the standard for tabular data tasks, we replicated the results of the TabLLM paper by using pre-trained LLMs on serialized tabular data in zero-shot, few-shot, and fully fine-tuned settings on nine datasets.
Serialization Methods
The authors of the original TabLLM paper experimented with a few different serialization methods, and we decided to try to recreate their results with three of them:
- Text Template: The format of each sentence follows: “The {feature name} is {feature value}.”
- List Template: Each feature is written on its own line with the format: “{feature name}: {feature value}”
- JSON: Each datapoint is written as its JSON string serialization: “{{feature_name}: {feature_value}, …}”. Similar to List Template, but on a single line.
- LLM Serialization: We prompt an LLM to convert the rows of our dataset into natural language sentences and use the outputs as inputs into another LLM. An example sentence might be: “The 40 year old single person with a secondary education and a service job has an average yearly balance of 4126 euros.”
Notably, the paper also ran tests with List Template without the feature names (List Only Values) and with permuted feature names (List Permuted Names) to test the importance of both the feature names and their connection with the correct feature. List Template generally outperformed both of these serialization formats in the zero- and few-shot settings, validating the intuition about the importance of the semantics of the feature names.
Models Used
The authors of the original TabLLM paper chose the pretrained T0 encoder-decoder model as their LLM of reference. We tested a pre-trained BERT Large model, alongside T0 for zero and few-shot experiments, as we believed it could lead to a better accuracy/latency trade-off because of its smaller size (350M parameters vs T0’s 11B).
Few-Shot Experiments
For the few-shot experiments, we settled on performing in-context learning, rather than fine-tuning the model and changing the weights, fitting as many labeled data points in the prompt as the model allowed. As such, we added examples to our prompts and fed them into T0. For example, one of the few-shot prompts for our Car Text Template dataset is:
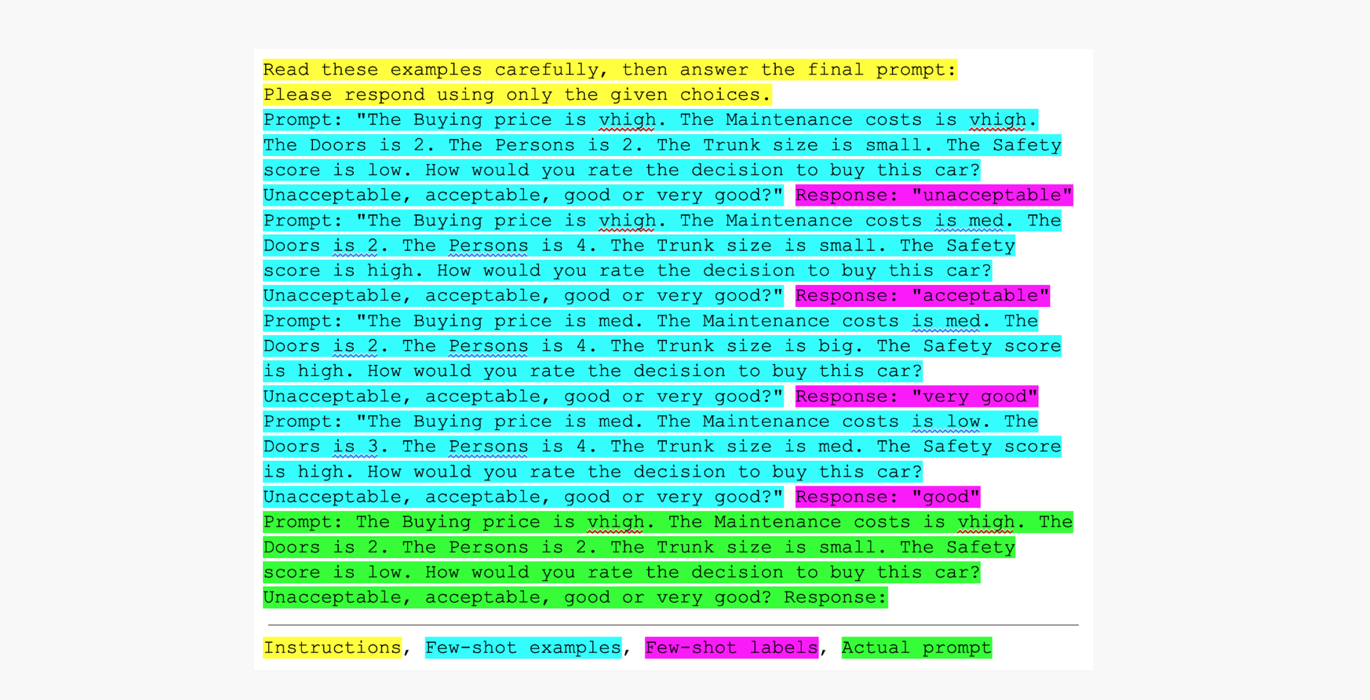
Example of a few-shot prompts for our Car Text Template dataset.
Data and Results
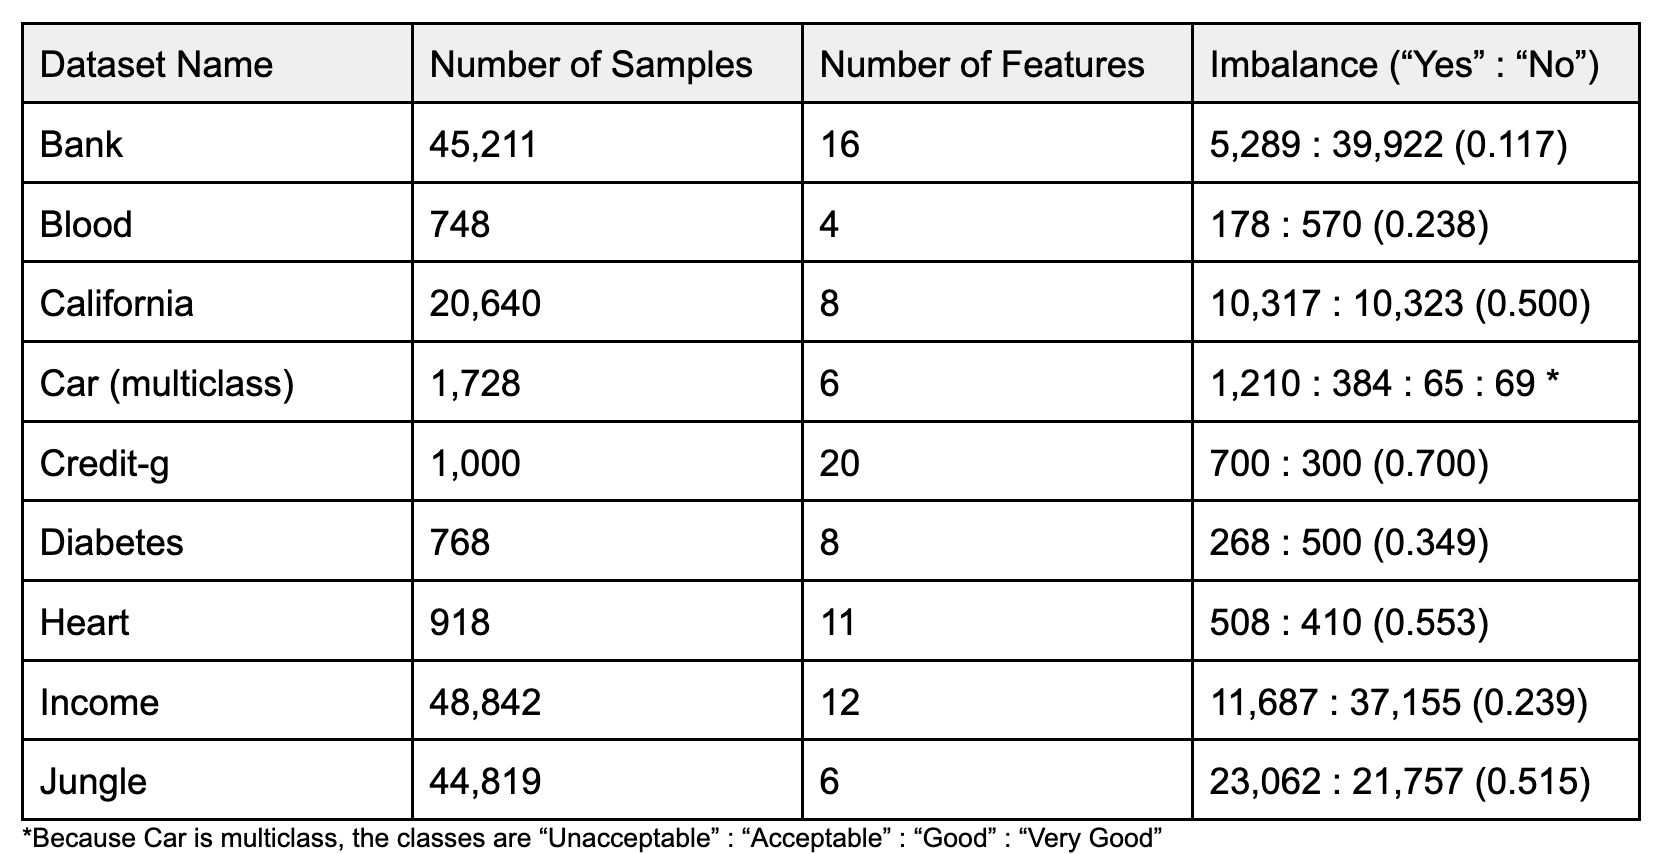
We used the same nine datasets as the original TabLLM paper (we did not use the healthcare dataset because we were unable to locate it), and the results of our experiments can be found at the end of the post.
Datasets:
Analysis
In our experiments with the fully fine-tuned models, we found that our version of TabLLM using BERT (using Text Template, List Template, or JSON serialization) matched or exceeded the performance reported in the paper on six out of nine datasets, and for two of the other three cases, our results differed by less than a hundredth. The original paper’s performance on the remaining dataset, Heart, beat ours by about two percent.
Our few-shot results, however, did not match the ones in the paper, suggesting that fine-tuning, even on a small number of examples, is more effective than in-context learning on tabular datasets. This finding is in-line with those reported in “TART: A plug-and-play Transformer module for task-agnostic reasoning” (Bhatia, et al.). If you’re interested in learning about how to fine-tune an LLM, check out our Ludwig 0.8 blog post.
Below, you can take a look at the AUROC scores obtained by the different methods, averaged across the datasets, from each of our different models. Our full AUROC results can be found at the end of this blog post. We are only reporting Text Template (TT) and List Template (LT) results in the zero-shot and few-shot sections due to their superior performance.
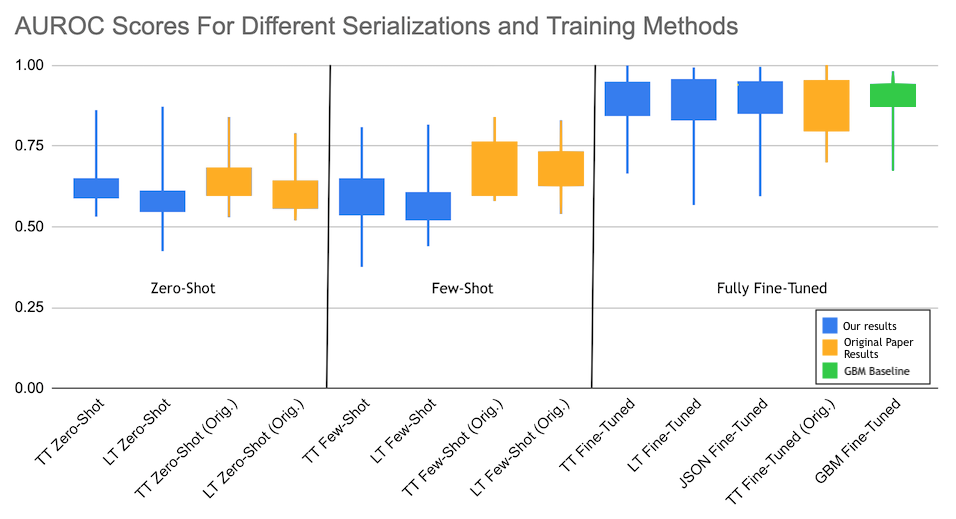
Despite multiple possible serialization approaches both the original TabLLM paper and our experiments suggest that there's no significant quality difference across rule-based serialization methods (Text Template, List Template, JSON) as long as the feature names and string values are provided in the prompt.
As mentioned previously, when stratified by training method (zero-shot, few-shot, and fully fine-tuned), the text template serialization method appeared to be the strongest, although the performance difference was not particularly large.
Overall, the fully fine-tuned and the zero-shot results appeared to support TabLLM’s viability as a way to execute tabular data tasks. In some cases, TabLLM can outperform GBMs in the fully-fine tuned setting, and, from both our data and the original paper’s, it seems that TabLLM’s performance approaches or exceeds that of GBMs more often on datasets with fewer features. Generally, however, GBMs have a similar performance distribution, but they are cheaper and faster to train, making them the go-to for tabular data classification when fully fine-tuned.
Why should you use LLMs for Tabular Data?
LLMs have shown impressive capabilities in many tasks both without examples (zero shot) and with examples (few shots) provided in the prompt, making them compelling to use on multiple tasks without specific fine-tuning. For several tabular datasets, we've reconfirmed the TabLLM paper's conclusions that LLMs can match fully trained models.
When considering the full spectrum of approaches to building predictive systems for tabular data with and without LLMs, what should be taken into account? When should an LLM be used?
1. LLMs provide out of the box quality with zero or very few examples.
The premier advantage of using Large Language Models (LLMs) is that they provide quality results out of the box due to their extensive pre-training, with zero or a very minimal number of examples, eliminating the need for task-specific training. This feature is especially valuable in situations with limited data or for users lacking deep machine learning knowledge but wanting to utilize AI for their data.
2. LLMs are inherently robust to missing values and correlated features.
Tabular data often contains correlated features that can distract regular ML models as they increase the model’s complexity without providing a comparable increase in new information. The flexibility of natural language also induces a similar flexibility in the LLM's ability to handle missing values. Where a neural network or gradient-boosted tree needs to either drop samples that have missing values or fill them in to ensure the network always has consistent shapes, for LLMs we can simply omit a missing value in the prompt.
3. Serializing tabular data simplifies the machine learning pipeline.
With LLMs, tabular data is serialized into text using the same tokenizer and processing parameters, streamlining the processing and feature extraction pipeline. As a further benefit, serializing data allows for feature types that gradient-boosted trees cannot handle easily without additional processing, such as text, sequences, sets, bags, dates and more.
4. A Naive but Intuitive Baseline
LLMs, as pure-text models, can serve as a naive but intuitive baseline to sanity check evaluation metrics of custom-built supervised models. For example, if GBM models are performing several points lower than LLMs, that's a good sign that there's a bug in your GBM pipeline.
What are the drawbacks of using LLMs for Tabular Data?
1. LLMs have limited context length.
LLMs have a maximum token limit, which can be problematic for datasets with many columns or when trying to leverage large datasets for few-shot examples.
2. LLM quality depends on good column semantics.
LLM performance heavily relies on the clarity and semantics of column names, especially in zero- and few-shot settings.
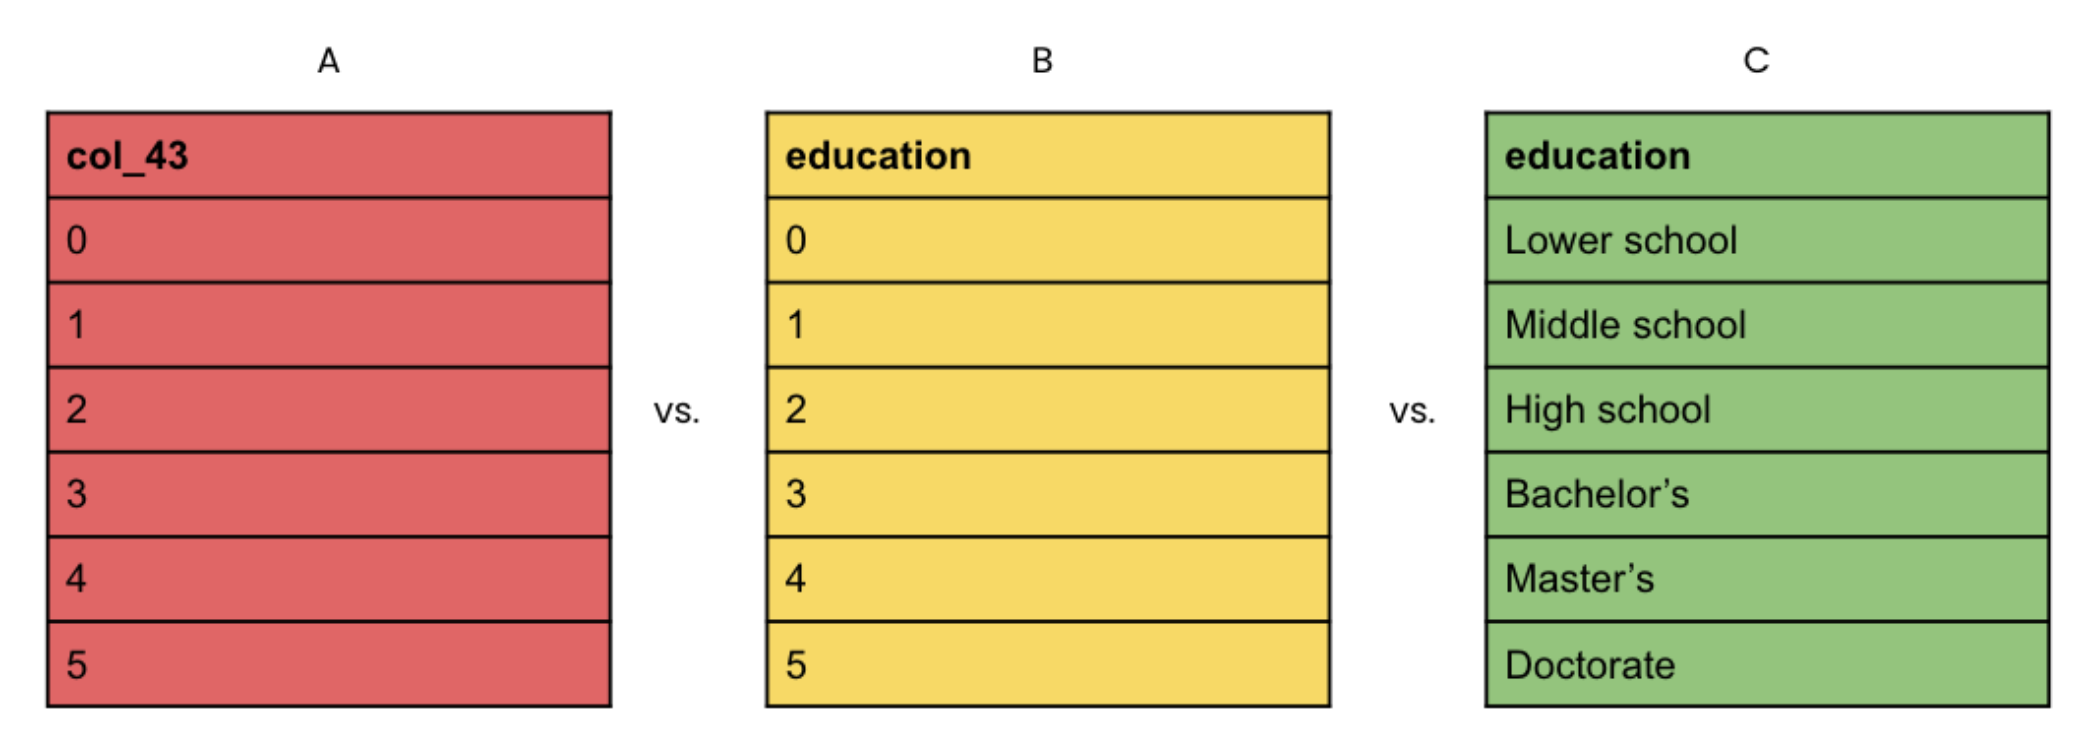
Figure: Language encodes important information about features. For neural networks, tree-based, and linear models, all three of these columns give the same amount of information as long as they are categorical variables. LLM’s performance depends rather heavily on good column semantics, particularly in the zero- and few-shot settings (see section 5.1 of TabLLM), as to take advantage of pre-trained LLM's understanding of the English language.
3. LLMs are unfit for tabular datasets that have many numeric features.
LLMs struggle with datasets dominated by numeric features. These lack semantic meaning and can consume many tokens without adding significant value.
4. LLMs have fewer tools for handling bias in imbalanced datasets.
LLMs in zero-shot and few-shot settings have a limited toolkit for managing bias in datasets where one class is significantly more prevalent than others. Traditional training methods offer more strategies for such imbalances, such as oversampling the minority class, undersampling the majority class, or applying different weights to different classes during model training.
5. LLMs are slower and more expensive to train and use.
LLMs are costlier and slower to train and use compared to models like GBMs and smaller neural networks, even when optimizing with techniques like quantization and PEFT.
6. State-of-the-art quality for data-rich tabular data is most often GBMs.
Gradient Boosting Machines (GBMs) remain the top choice for many tabular datasets, particularly when abundant data is available.
Next Steps: Using LLMs for Tabular Data
In this post, we've unpacked essential ideas from the TabLLM paper and shared our perspectives on the applicability and effectiveness of LLMs for tabular data tasks.
While LLMs provide many advantages for tabular data, especially in low-data scenarios, they come with challenges as well. LLMs provide an intuitive baseline for model performance and they also provide a great option when data is scarce. The advantages of using LLMs, however, should be considered in the wider context of tabular data modeling, where factors such as data richness, cost, speed, and the nature of features come into play and may warrant the use of other models like GBMs.
If you would like to try out tabular data serialization on Predibase, check out our step-by-step tutorial, "How to Use LLMs on Tabular Data" tutorial, to learn how.
Appendix A: Few-Shot Experiments
We noticed that our few-shot results were not always stronger than our zero-shot results, so we wanted to test the extent to which they depended on the examples given. We ran experiments with several different sets of few-shot examples on our seven smallest Text Template-serialized datasets:
- Fixed examples: we hand-picked four labeled examples from our dataset
- Similarity: for each sample, we used the four most similar examples from a test set (using cosine similarity on the BERT embeddings of the serialized data)
- Feature Similarity: same as number 2, but instead of using the BERT embeddings of the serialized data, we used the BERT embeddings of just the feature values (i.e., the embeddings of “vhigh, vhigh, 2, 2, small, low”)
- Balanced Similarity: same as number 2, but we balanced the number of examples based on label (i.e., two “yes” examples and two “no” examples)
- Random: we picked four random examples for each sample (we ran this test four to five times on our datasets and averaged the results)
The table below shows our AUROC scores for each of the above few-shot prompt styles.
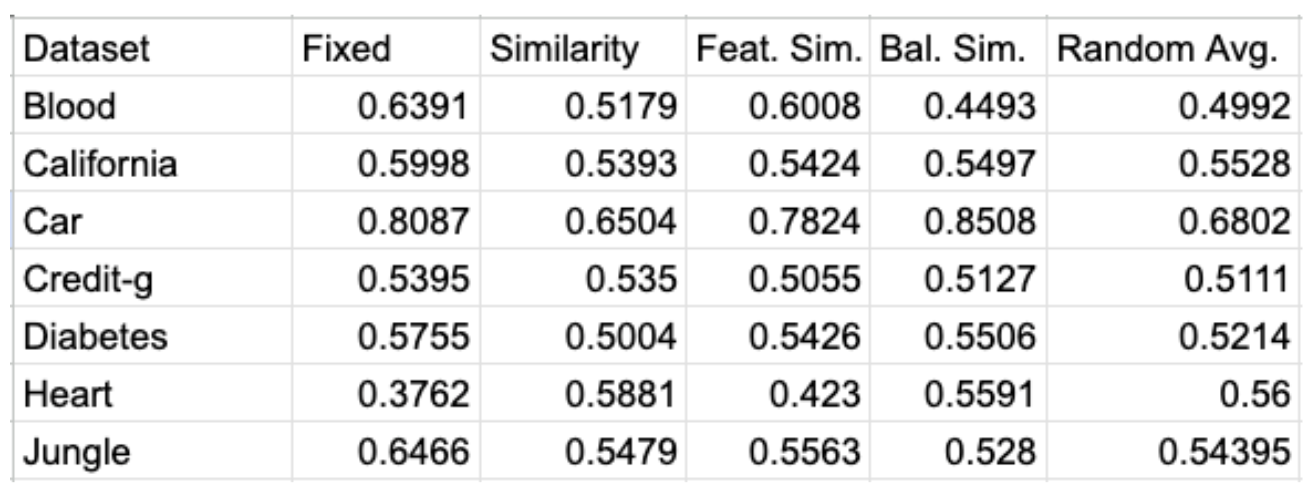
AUROC scores for each of the above few-shot prompt styles.
Our results showed that, with only four examples in each prompt, the model’s performance was very sensitive to the examples used. Furthermore, randomly selecting few-shot examples worsened T0pp’s performance compared to selecting few-shot examples either manually or with a similarity metric, on average.
Appendix B: Detailed Results
These are all of the results from our experiments (they were summarized in the boxplot above). See Appendix A: Few-Shot Experiments for more detail about our few-shot results.
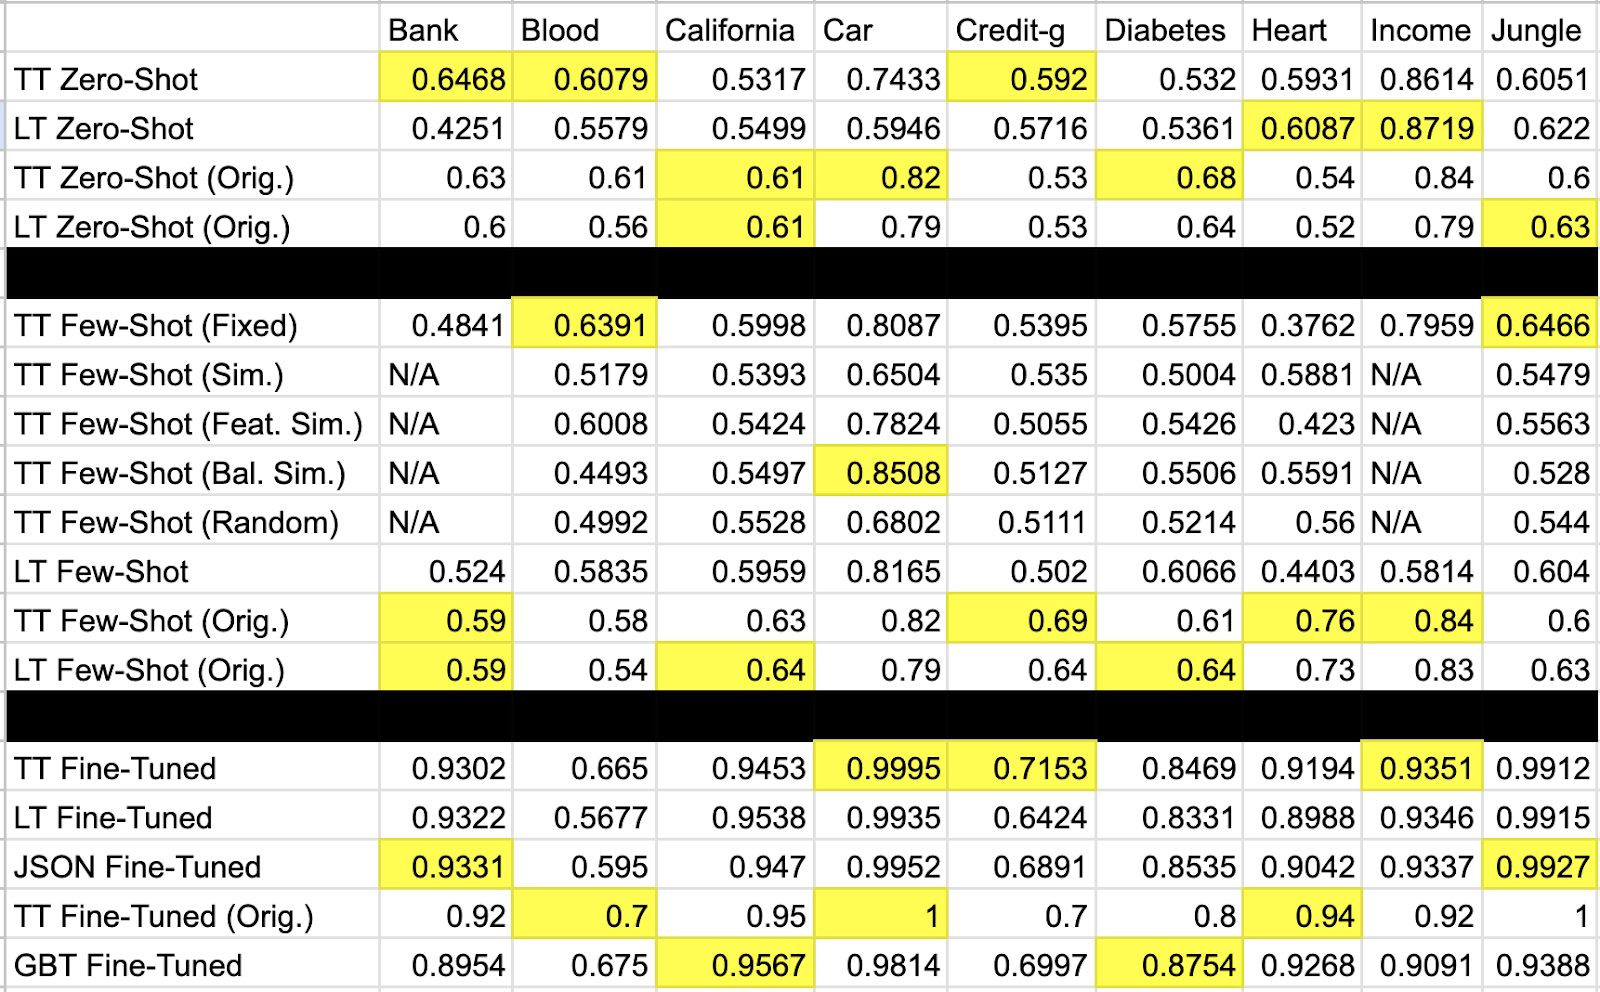
Full set of the results from our LLM experiments on tabular data.
